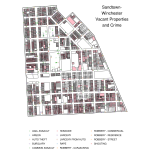
Visualizing Baltimore 3.1: Crime and Vacant Properties, Neighborhood Level, Bit More Polished
Redos of the plots from this post: Bit more communicative, though the overplotting is a bit annoying. Code: ## gis libraries library(spBayes) library(MBA) library(geoR) library(fields) library(sp) library(maptools) library(rgdal) library(classInt) library(lattice) library(xtable) library(spatstat) library(splancs) ## Other packages library(ggplot2) library(foreign) library(stringr) library(lubridate)...