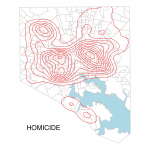
Visualizing Baltimore with R and ggplot2: Crime Data
The advent of municipal open data initiatives has been both a blessing and curse for my particular brand of data nerd. On one hand, it has opened up the possibility of developing deep and useful knowledge about the places we...
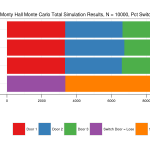
A Monty Hall Monte Carlo, Part 1? (Oh God)
While I dig into conjugacy and the calculation of Bayesian credibility intervals, I figured it'd be good to put some of my other little rabbit holes up here on the off chance they're interesting to someone. For some reason I...