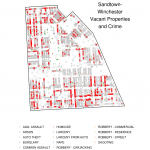
Visualizing Baltimore 3.1: Crime and Vacant Properties, Neighborhood Level, Bit More Polished
Redos of the plots from this post: Bit more communicative, though the overplotting is a bit annoying. Code: ## gis libraries library(spBayes) library(MBA) library(geoR) library(fields) library(sp) library(maptools) library(rgdal) library(classInt) library(lattice) library(xtable) library(spatstat) library(splancs) ## Other packages library(ggplot2) library(foreign) library(stringr) library(lubridate)...
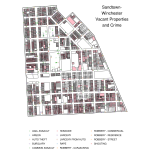
Visualizing Baltimore 3: Crime and Vacant Properties, Neighborhood Level
A few quick plots of West Baltimore neighborhoods, first Sandtown-Winchester: and Harlem Park: These aren't very polished, I'll put up better versions. Here's the code for those that want it: ## gis libraries library(spBayes) library(MBA) library(geoR) library(fields) library(sp) library(maptools) library(rgdal)...
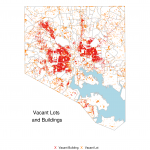
Visualizing Baltimore 2: Vacant Property and Some More Crime
One of the key predictors in my model for this crime project I'm working on is vacant houses and lots. I'll speak to some findings about the relationship between levels of the different types of crime and vacant property in...
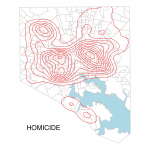
Visualizing Baltimore with R and ggplot2: Crime Data
The advent of municipal open data initiatives has been both a blessing and curse for my particular brand of data nerd. On one hand, it has opened up the possibility of developing deep and useful knowledge about the places we...