Visualizing Baltimore 3.1: Crime and Vacant Properties, Neighborhood Level, Bit More Polished
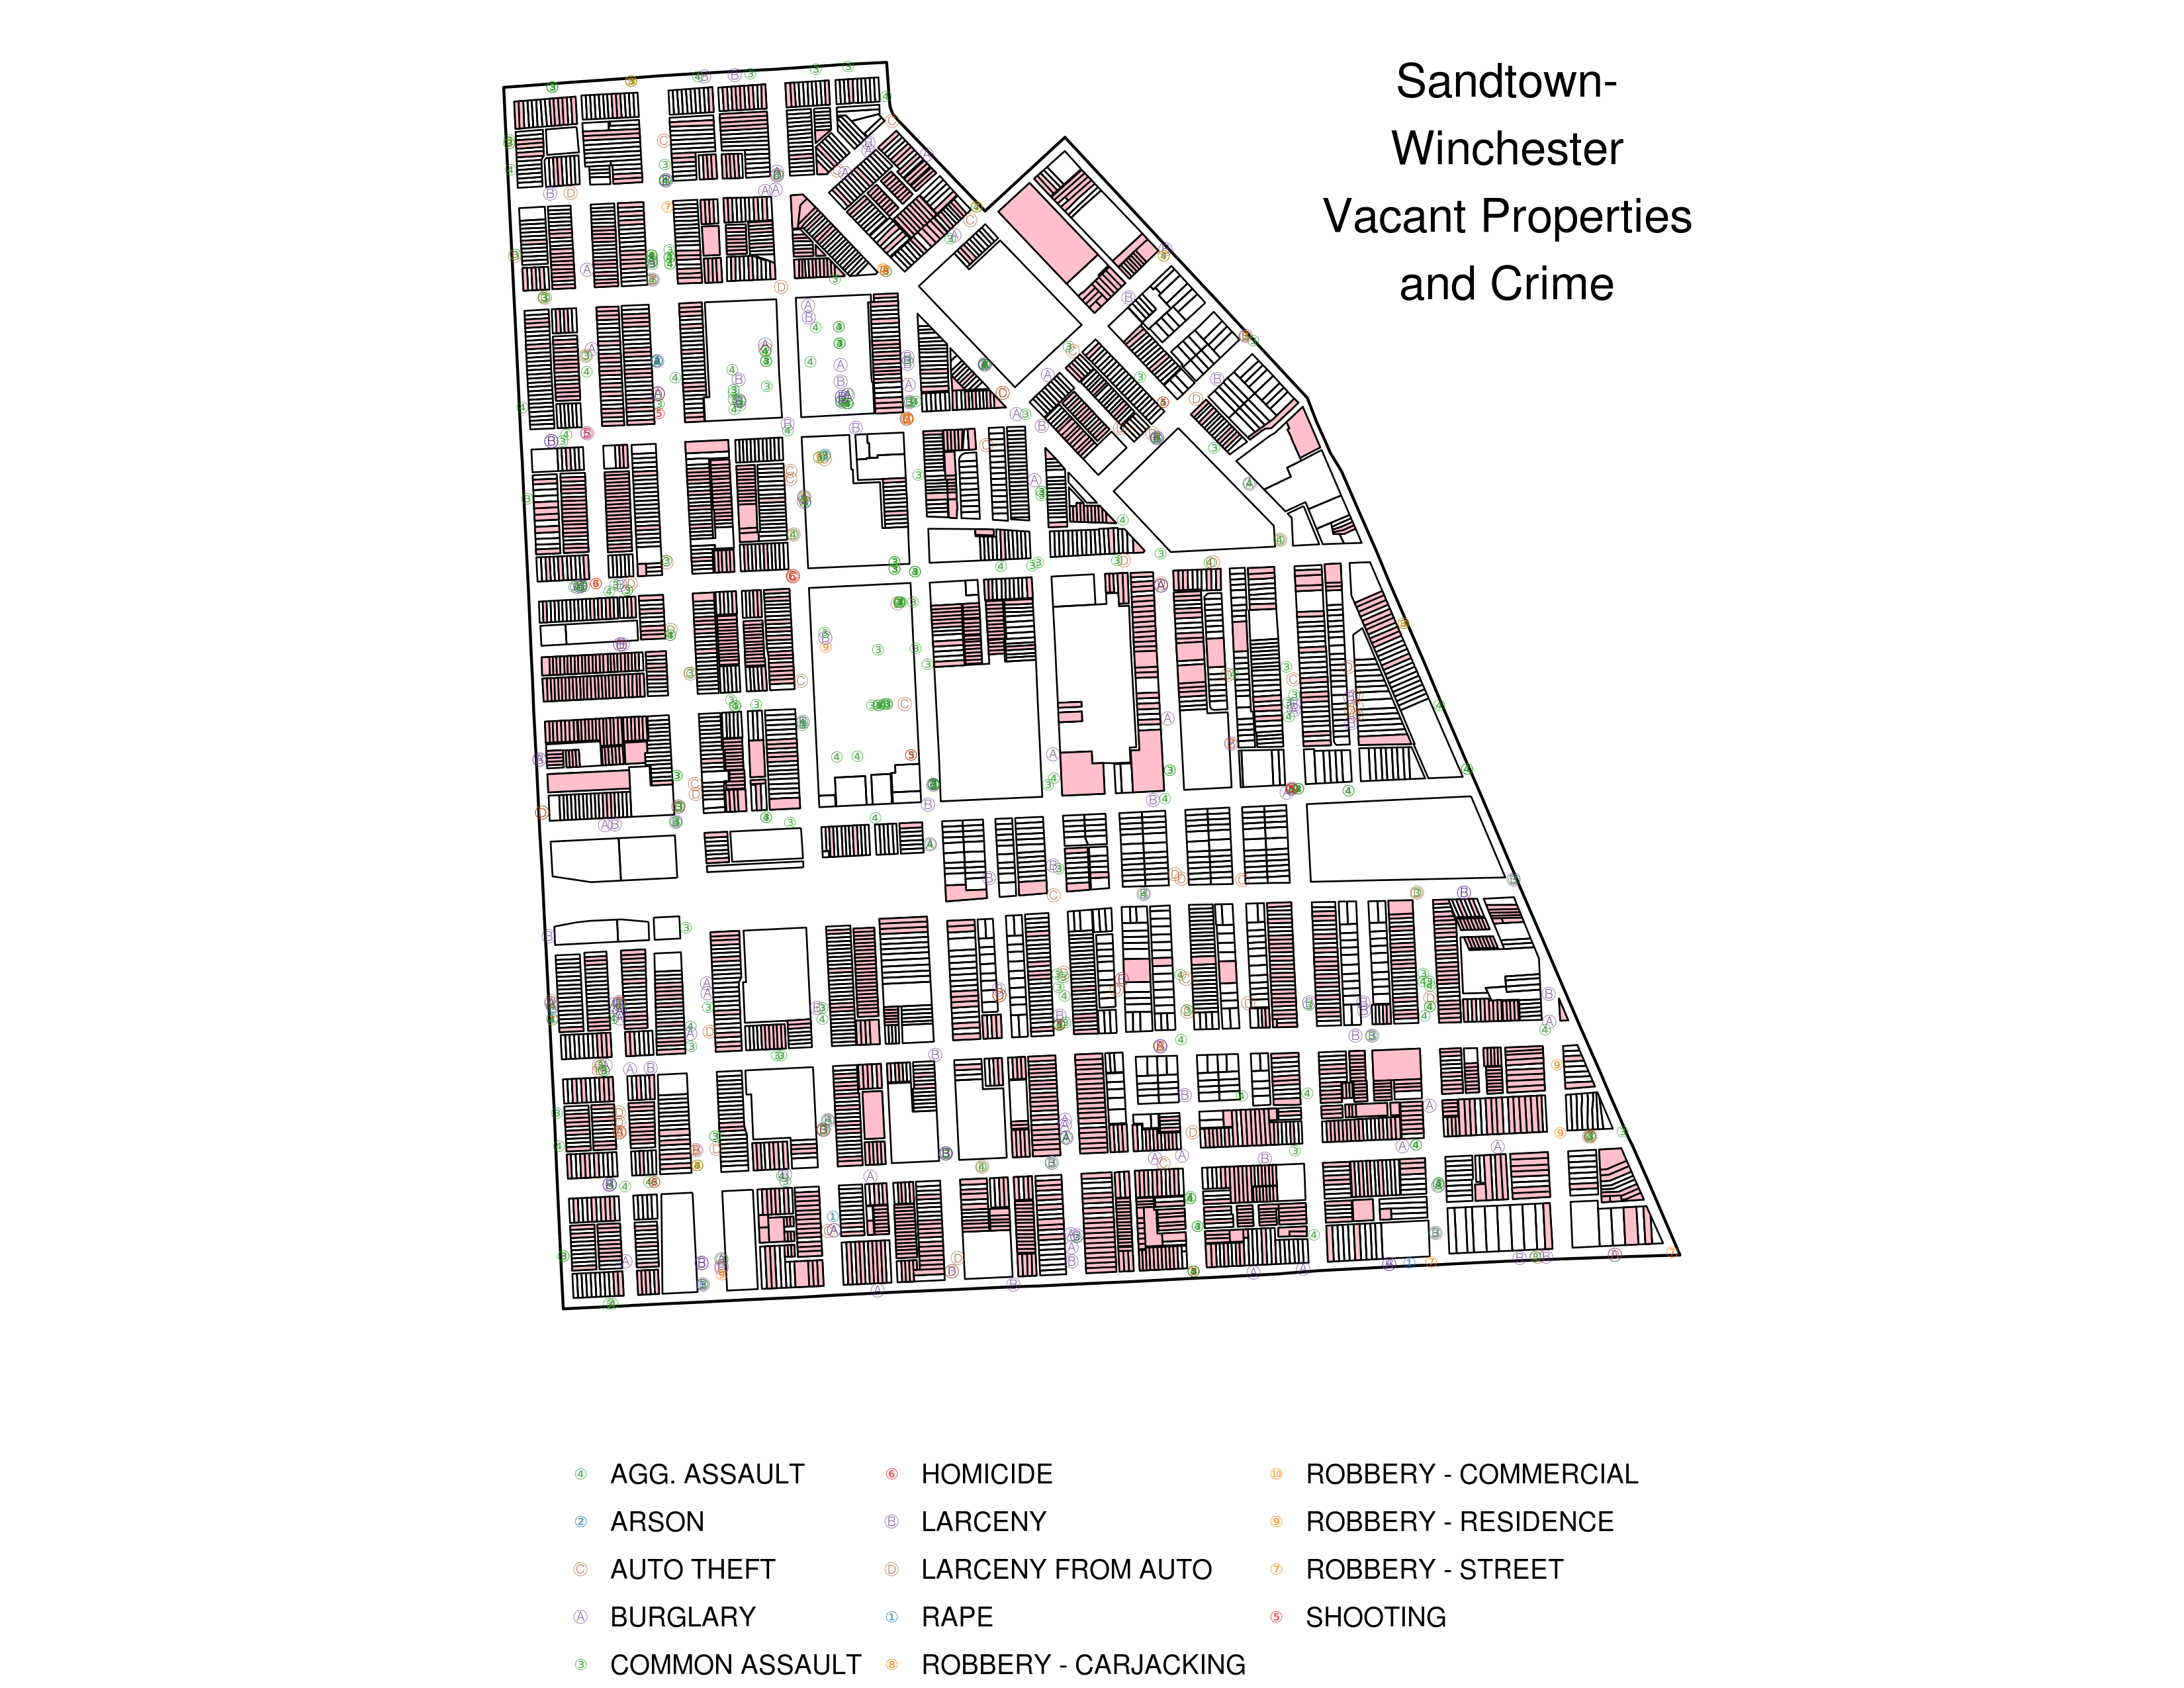
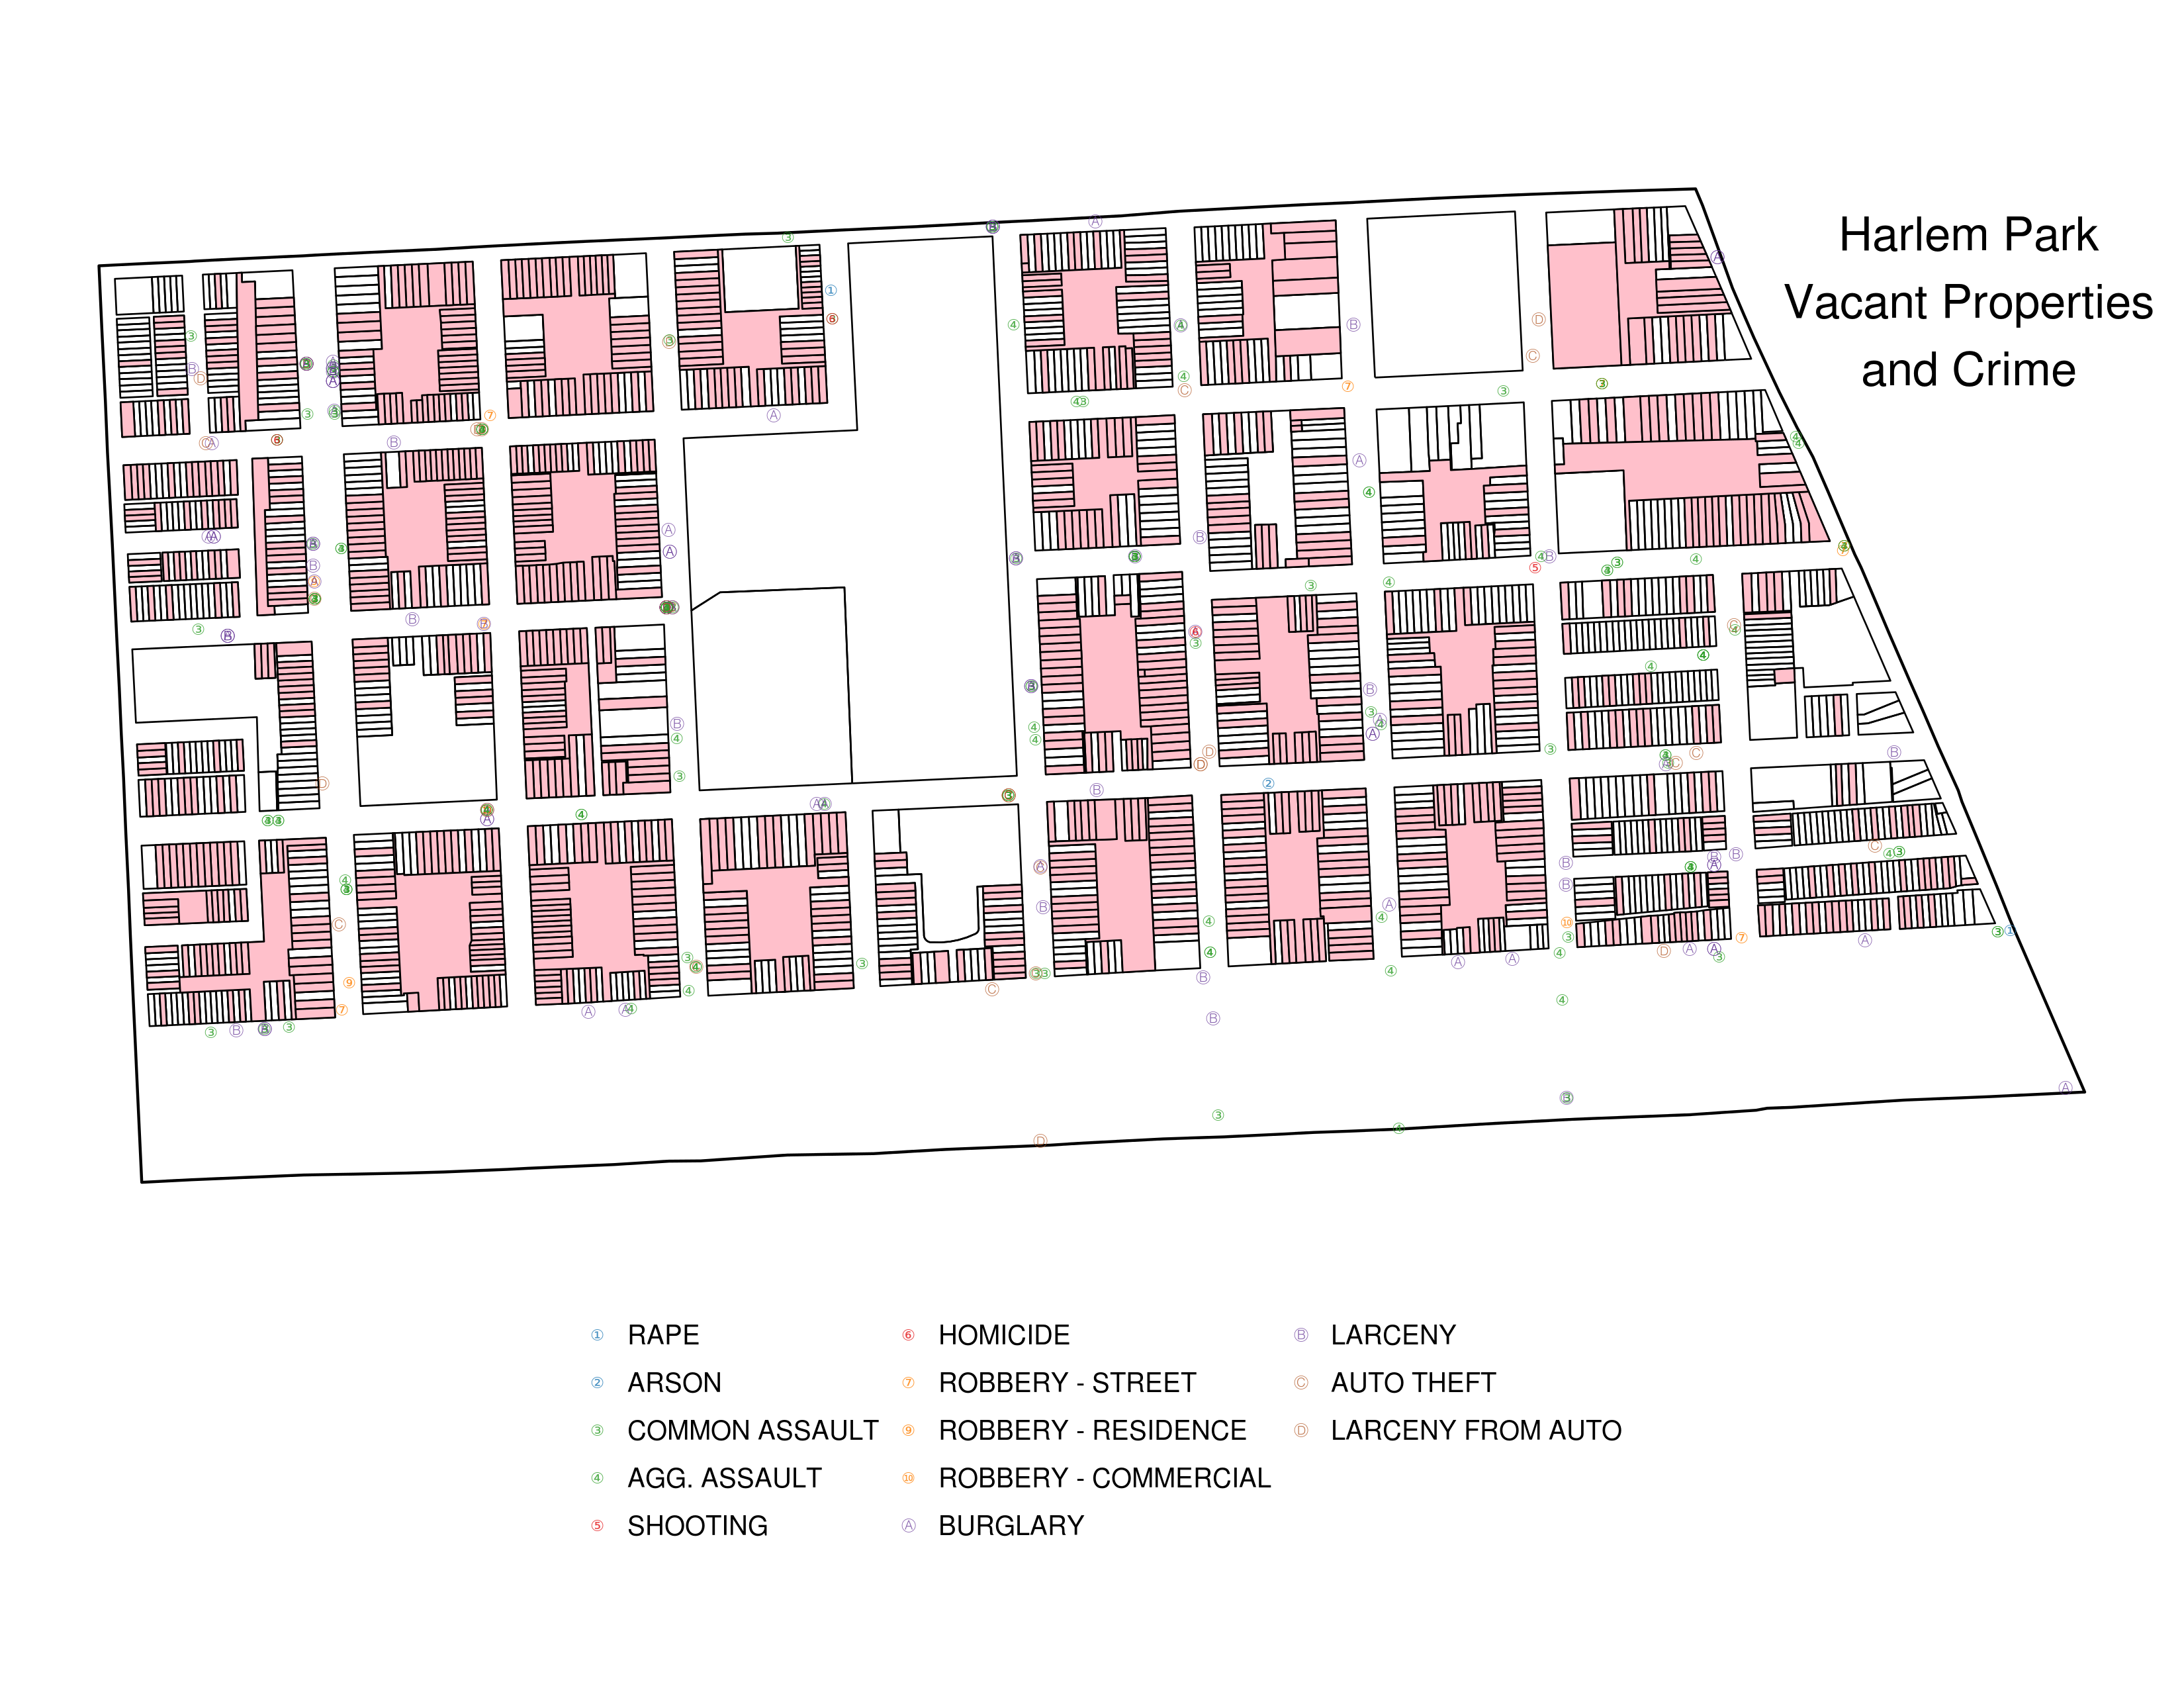
Redos of the plots from this post:
Bit more communicative, though the overplotting is a bit annoying.
Code:
## gis libraries
library(spBayes)
library(MBA)
library(geoR)
library(fields)
library(sp)
library(maptools)
library(rgdal)
library(classInt)
library(lattice)
library(xtable)
library(spatstat)
library(splancs)

## Other packages
library(ggplot2)
library(foreign)
library(stringr)
library(lubridate)
library(plyr)
library(xtable)
library(scales)
library(RColorBrewer)
library(grid)
library(ggmap)
library(gridExtra)
library(ggmcmc)

setwd('/home/rmealey/Dropbox/school/gisClass/FinalProject')
options(digits=10)

Save <- function(projName){
	savehistory(paste(projName,'.Rhistory',sep=''))
	save.image(paste(projName,'.RData',sep=''))
}

sv <- function() Save('FinalProject')

########################################################################
## Utility Functions

## Read lat/lng coords function
str2LatLong <- function(in_df){
	latlng <- str_replace(str_replace(in_df$Location.1,'\$$',''),')','')
	latlng <- str_split(latlng,', ')
	latlng_df <- ldply(latlng[in_df$Location.1 != ''])
	out_df <- in_df
	out_df$lat <- as.numeric(latlng_df[,1])
	out_df$long <- as.numeric(latlng_df[,2])
	return(out_df)
}

## convert projection function
convProj <- function(in_df,in_proj,out_proj){
	latlong <- in_df[,c('long','lat')]
	latlong_spdf <- SpatialPoints(latlong,
	proj4string=in_proj)
	latlong_spdf <-  spTransform(latlong_spdf,out_proj)
	latlong_spdf_coords <- coordinates(latlong_spdf)
	out_df <- in_df
	out_df$long <- latlong_spdf_coords[,1]
	out_df$lat <- latlong_spdf_coords[,2]
	return(out_df)
}

########################################################################
# City Boundary Shape File
city_df <- read.dbf('Baltcity_20Line/baltcity_line.dbf')
city_shp <- readOGR(dsn='Baltcity_20Line', layer='baltcity_line')
origProj <- city_shp@proj4string ## Store original projection
#city_shp = spTransform(city_shp,CRS("+proj=longlat +datum=WGS84"))
city_pl_df <- fortify(city_shp, region='LABEL')
cityLineCoords <- data.frame(city_shp@lines[[1]]@Lines[[1]]@coords)
cityLinePoly <- Polygon(cityLineCoords)
cityLinePolys <- Polygons(list(cityLinePoly), ID='cityline')
cityLineSpPoly <- SpatialPolygons(list(cityLinePolys),proj4string=origProj)

cityLineCoords <- cityLineCoords[,c(2,1)]

########################################################################
# Neighborhood Shape Files
# Source:

## Neighborhood Shape Files read in v1
nbhds_df <- read.dbf('Neighborhood_202010/nhood_2010.dbf')
nbhds_shp <- readOGR(dsn='Neighborhood_202010', layer='nhood_2010')
origProj <- nbhds_shp@proj4string ## Store original projection
#nbhds_shp = spTransform(nbhds_shp,CRS("+proj=longlat +datum=WGS84"))
nbhds_pl_df <- fortify(nbhds_shp, region='LABEL')
names(nbhds_shp@polygons) <- nbhds_shp@data$LABEL

## Neighborhood Shape Files read in v2 (from spatstat docs)
#nbhds_shp <- readShapePoly('Neighborhood_202010/nhood_2010.shp')
#nbhds_sp <- as(nbhds_shp, "SpatialPolygons")
#nbhds_owin <- as(nbhds_sp, "owin")
#centroids <- coordinates(nbhds_shp)

hoodNames <- 'Mount Vernon'
ggplot(data=nbhds_pl_df[nbhds_pl_df$id==hoodNames,],
aes(x=long, y=lat, group=group)) +
geom_path() +
ggtitle(hoodNames) +
coord_equal()

########################################################################
# Parcel Shape Polygon Data
parcel_shp <- readOGR(dsn='Parcel_Shp', layer='parcel')

## Deduplicate polygons and dataframe
parcel_shp2 <- parcel_shp[!duplicated(parcel_shp$BLOCKLOT),]
parcel_mtrx <- as.matrix(coordinates(parcel_shp2))
colnames(parcel_mtrx) <- c('long','lat')
rownames(parcel_mtrx) <- parcel_shp2$BLOCKLOT
parcel_shp2$Type <- NA

########################################################################
# Vacant Buildings
vacantBuildings_df <- read.csv('OpenDataSets/Vacant_Buildings.csv')
vacantBuildings_df <- str2LatLong(vacantBuildings_df)
inProj <- CRS("+proj=longlat +datum=WGS84")
outProj <- origProj
vacantBuildings_df <- convProj(vacantBuildings_df, inProj, outProj)
vacantBuildings_df$type <- 'Vacant Building'
vacBld_mtrx <- as.matrix(vacantBuildings_df[,c('long','lat')])
vacantBuildings_parc <- parcel_shp2[parcel_shp2$BLOCKLOT%in%vacantBuildings_df$blockLot,]

########################################################################
# Vacant Lots
# Source:
vacantLots_df <- read.csv('OpenDataSets/Vacant_Lots.csv')
vacantLots_df <- str2LatLong(vacantLots_df)
inProj <- CRS("+proj=longlat +datum=WGS84")
outProj <- origProj
vacantLots_df <- convProj(vacantLots_df, inProj, outProj)
vacantLots_df$type <- 'Vacant Lot'
vacantLots_mtrx <- as.matrix(vacantLots_df[,c('long','lat')])
vacantLots_parc <- parcel_shp2[parcel_shp2$BLOCKLOT%in%vacantLots_df$blockLot,]


########################################################################
## Crime Data
crimeData <- read.csv('OpenDataSets/BPD_Part_1_Victim_Based_Crime_Data.csv')
crimeData_NoCoords <- crimeData[crimeData$Location.1 == '',]
crimeData <- crimeData[crimeData$Location.1 != '',]

## Get and convert projection
crimeData <- str2LatLong(crimeData)
## Incidents already in correct proj
crimeData_ProjOrig <- crimeData[crimeData$lat>100,]
crimeData <- crimeData[crimeData$lat<100,]
inProj <- CRS("+proj=longlat +datum=WGS84")
outProj <- origProj
crimeData <- convProj(crimeData, inProj, outProj)

crime_mtrx <- as.matrix(crimeData[,c('long','lat')])

## Parse Dates
crimeData$crimeDate2 <- parse_date_time(
	crimeData$crimeDate,
	orders='%m/%d/%Y'
)

## Get Burglary Incidents
burg_df <- subset(crimeData, description=='BURGLARY')
## Hold Out 2012 Incidents
burg_df_ho <- subset(burg_df, year(crimeDate2) == '2012')
burg_df <- subset(burg_df, year(crimeDate2) != '2012')
ggplot(data=burg_df, aes(x=long,y=lat)) + geom_point() + coord_equal()

## Get Street Robbery Incidents
robbStr_df <- subset(crimeData, description=="ROBBERY - STREET")
## Hold Out 2012 Incidents
robbStr_df_ho <- subset(robbStr_df, year(crimeDate2) == '2012')
robbStr_df <- subset(robbStr_df, year(crimeDate2) != '2012')
ggplot(data=robbStr_df, aes(x=long,y=lat)) + geom_point() + coord_equal()

## Homicide
homic_df <- subset(crimeData, description=='HOMICIDE')
## Hold Out 2012 Incidents
homic_df_ho <- subset(homic_df, year(crimeDate2) == '2012')
homic_df <- subset(homic_df, year(crimeDate2) != '2012')
ggplot(data=homic_df, aes(x=long,y=lat)) + geom_point() + coord_equal()

## Aggravated Assault
aggrAslt_df <- subset(crimeData, description=='AGG. ASSAULT')
## Hold Out 2012 Incidents
aggrAslt_df_ho <- subset(aggrAslt_df, year(crimeDate2) == '2012')
aggrAslt_df <- subset(aggrAslt_df, year(crimeDate2) != '2012')
ggplot(data=aggrAslt_df, aes(x=long,y=lat)) + geom_point() + coord_equal()

########################################################################
# Plot by Neighborhood

nbhd_name <- 'Sandtown-Winchester'
plot_title <- "Sandtown-\nWinchester\nVacant Properties\nand Crime"
plot_title_x <- 1415200
plot_title_y <- 598300
file_name <- 'SandtownWinchesterVacantsandCrime'

##border
nbhd_border_df <- fortify(nbhds_shp@polygons[[nbhd_name]])
sw_mtr <- as.matrix(nbhd_border_df[,1:2])

## Parcels in nbhd
sw_props <- data.frame(pip(parcel_mtrx, sw_mtr))
sw_polys <- parcel_shp2[parcel_shp2$BLOCKLOT%in%rownames(sw_props),]
sw_polys_df <- fortify(sw_polys)

## Vacants in nbhd
sw_vb <- vacantBuildings_parc[vacantBuildings_parc$BLOCKLOT%in%rownames(sw_props),]
sw_vl <- vacantLots_parc[vacantLots_parc$BLOCKLOT%in%rownames(sw_props),]

## Crime in nbhd
sw_crime <- data.frame(pip(crime_mtrx, sw_mtr))
sw_crime <- crimeData[rownames(sw_crime),]
sw_crime_2012 <- subset(sw_crime, year(crimeDate2)==2012)
colnames(sw_props) <- c('long','lat')
colnames(sw_vacB) <- c('long','lat')
colnames(sw_vacL) <- c('long','lat')

# https://github.com/wch/ggplot2/wiki/New-theme-system
new_theme_empty <- theme_bw()
new_theme_empty$line <- element_blank()
new_theme_empty$rect <- element_blank()
new_theme_empty$strip.text <- element_blank()
new_theme_empty$axis.text <- element_blank()
new_theme_empty$plot.title <- element_blank()
new_theme_empty$axis.title <- element_blank()
new_theme_empty$legend.position <- 'bottom'
new_theme_empty$plot.margin <- structure(c(0, 0, -1, -1),
unit = "lines", valid.unit = 3L, class = "unit")

crimeCols <- brewer.pal(12,'Paired')

crimeTypes <- list('RAPE'=c(crimeCols[1],crimeCols[2]),
'ARSON'=c(crimeCols[1],crimeCols[2]),
'COMMON ASSAULT'=c(crimeCols[3],crimeCols[4]),
'AGG. ASSAULT'=c(crimeCols[3],crimeCols[4]),
'SHOOTING'=c(crimeCols[5],crimeCols[6]),
'HOMICIDE'=c(crimeCols[5],crimeCols[6]),
'ROBBERY - STREET'=c(crimeCols[7],crimeCols[8]),
'ROBBERY - CARJACKING'=c(crimeCols[7],crimeCols[8]),
'ROBBERY - RESIDENCE'=c(crimeCols[7],crimeCols[8]),
'ROBBERY - COMMERCIAL'=c(crimeCols[7],crimeCols[8]),
'BURGLARY'=c(crimeCols[9],crimeCols[10]),
'LARCENY'=c(crimeCols[9],crimeCols[10]),
'AUTO THEFT'=c(crimeCols[11],crimeCols[12]),
'LARCENY FROM AUTO'=c(crimeCols[11],crimeCols[12]))

crimeCols <- as.data.frame(t(data.frame(crimeTypes)))
col_cols <- crimeCols[,2]
names(col_cols) <- names(crimeTypes)

ggplot(data = nbhd_border_df) +
geom_polygon(aes(x=long, y=lat, group=group),
color='black', fill='white') +
geom_path(data=sw_polys_df,
aes(x=long,y=lat,group=group),
size=.3) +
geom_polygon(data = sw_vb,
aes(x=long, y=lat, group=group),
color = 'black', fill='pink',size=.3) +
geom_polygon(data = sw_vl,
aes(x=long, y=lat, group=group),
color = 'black', fill='pink',size=.3) +
geom_jitter(data = sw_crime_2012,
aes(x=long, y=lat, color=description, shape=description),
size=2, alpha='.8') +
scale_color_manual(values = col_cols) +
scale_shape_manual(values = crime_shapes) +
coord_equal() +
annotate("text", x = plot_title_x, y = plot_title_y,
label=plot_title,
size=6, color="black") +
new_theme_empty +
guides(color=guide_legend("",nrow=5),shape=guide_legend("",nrow=5)) +
ggsave(paste('img/',file_name,'.png',sep=''),width=11, height=8.5)

########################################################################
# Vacant Lots
nbhd_name <- 'Harlem Park'
plot_title <- "Harlem Park\nVacant Properties\nand Crime"
plot_title_x <- 1416400
plot_title_y <- 594500
file_name <- 'HarlemParkVacantsandCrime'

##border
nbhd_border_df <- fortify(nbhds_shp@polygons[[nbhd_name]])
sw_mtr <- as.matrix(nbhd_border_df[,1:2])

## Parcels in nbhd
sw_props <- data.frame(pip(parcel_mtrx, sw_mtr))
sw_polys <- parcel_shp2[parcel_shp2$BLOCKLOT%in%rownames(sw_props),]
sw_polys_df <- fortify(sw_polys)

## Vacants in nbhd
sw_vb <- vacantBuildings_parc[vacantBuildings_parc$BLOCKLOT%in%rownames(sw_props),]
sw_vl <- vacantLots_parc[vacantLots_parc$BLOCKLOT%in%rownames(sw_props),]

## Crime in nbhd
sw_crime <- data.frame(pip(crime_mtrx, sw_mtr))
sw_crime <- crimeData[rownames(sw_crime),]
sw_crime_2012 <- subset(sw_crime, year(crimeDate2)==2012)
colnames(sw_props) <- c('long','lat')
colnames(sw_vacB) <- c('long','lat')
colnames(sw_vacL) <- c('long','lat')

# https://github.com/wch/ggplot2/wiki/New-theme-system
new_theme_empty <- theme_bw()
new_theme_empty$line <- element_blank()
new_theme_empty$rect <- element_blank()
new_theme_empty$strip.text <- element_blank()
new_theme_empty$axis.text <- element_blank()
new_theme_empty$plot.title <- element_blank()
new_theme_empty$axis.title <- element_blank()
new_theme_empty$legend.position <- 'bottom'
new_theme_empty$plot.margin <- structure(c(0, 0, -1, -1),
unit = "lines", valid.unit = 3L, class = "unit")

crimeCols <- brewer.pal(12,'Paired')

crimeTypes <- list('RAPE'=c(crimeCols[1],crimeCols[2],'①'),
'ARSON'=c(crimeCols[1],crimeCols[2],'②'),
'COMMON ASSAULT'=c(crimeCols[3],crimeCols[4],'③'),
'AGG. ASSAULT'=c(crimeCols[3],crimeCols[4],'④'),
'SHOOTING'=c(crimeCols[5],crimeCols[6],'⑤'),
'HOMICIDE'=c(crimeCols[5],crimeCols[6],'⑥'),
'ROBBERY - STREET'=c(crimeCols[7],crimeCols[8],'⑦'),
'ROBBERY - CARJACKING'=c(crimeCols[7],crimeCols[8],'⑧'),
'ROBBERY - RESIDENCE'=c(crimeCols[7],crimeCols[8],'⑨'),
'ROBBERY - COMMERCIAL'=c(crimeCols[7],crimeCols[8],'⑩'),
'BURGLARY'=c(crimeCols[9],crimeCols[10],'Ⓐ'),
'LARCENY'=c(crimeCols[9],crimeCols[10],'Ⓑ'),
'AUTO THEFT'=c(crimeCols[11],crimeCols[12],'Ⓒ'),
'LARCENY FROM AUTO'=c(crimeCols[11],crimeCols[12],'Ⓓ'))

crimeCols <- as.data.frame(t(data.frame(crimeTypes)))
col_cols <- crimeCols[,2]
crime_shapes <- crimeCols[,3]
names(col_cols) <- names(crimeTypes)
names(crime_shapes) <- names(crimeTypes)

sw_crime_2012$description <- ordered(sw_crime_2012$description,
levels=names(crimeTypes))

ggplot(data = nbhd_border_df) +
geom_polygon(aes(x=long, y=lat, group=group),
color='black', fill='white') +
geom_path(data=sw_polys_df,
aes(x=long,y=lat,group=group),
size=.3) +
geom_polygon(data = sw_vb,
aes(x=long, y=lat, group=group),
color = 'black', fill='pink',size=.3) +
geom_polygon(data = sw_vl,
aes(x=long, y=lat, group=group),
color = 'black', fill='pink',size=.3) +
geom_jitter(data = sw_crime_2012,
aes(x=long, y=lat, color=description, shape=description),
size=2, alpha='.8') +
scale_color_manual(values = col_cols) +
scale_shape_manual(values = crime_shapes) +
coord_equal() +
annotate("text", x = plot_title_x, y = plot_title_y,
label=plot_title,
size=6, color="black") +
new_theme_empty +
guides(color=guide_legend("",nrow=5),shape=guide_legend("",nrow=5)) +
ggsave(paste('img/',file_name,'.png',sep=''),width=11, height=8.5)


Hi,
Can you please help me to make the following graph in R.
http://ge.tt/24iG4Sw/v/0?c
I am unable to get the source data but any overlapping time series should do.
Br / P
This data is beautiful.